
The things on the screen — numbers, tables, graphs, forms, dashboards — are just two-dimensional projections of a multi-dimensional data landscape. That data landscape in turn is just a representation of real-world phenomena and domain concepts. The design practices in this article will help you “see through” the product surface into the data and domain layers, and re-orient your work around them.

After 30 years in design, I’ve spent the last year building a data-intensive product as a solo builder, learning software engineering and data science on the way. Obviously, I had to learn a lot of new technical skills — but I’ve also been pleasantly surprised by how much this has taught me about design. Both reinforcing things I already knew, and highlighting blind spots in my design practice. I’ve distilled these lessons into 10 suggestions — not a comprehensive canon, but hard-earned and hopefully useful for fellow designers tackling similar challenges.
- Learn Python.
- Learn your users’ job.
- Let the data draw the page for you.
- Strip back the chrome.
- Design the empty state.
- Work with real(istic) data.
- Pre-populate intelligently.
- Bridge mental models and data models.
- Words matter.
- Simple and explicit navigation.
Learn Python
With a few notable exceptions, most advice on “learning code” for designers emphasises front-end and web frameworks. That makes sense if your focus is UI. But if you are interested in shaping interaction and functionality in complex, data-intensive products — which probably includes LLM-powered interactions — Python is the natural choice. It gives you a concise, readable, powerful language in which to describe data and logic. You need this for communication even if an LLM writes all your code.
Learn your users’ job
Practice it on the tool you are building (AKA UX Dogfooding). Watch users perform it on the tool you are building. Note the differences. There should be no functionality in the system that you haven’t both used yourself and observed with end-users. This is the only way for you to build intuition for the meaning, value, and relationships in the data you are working with.
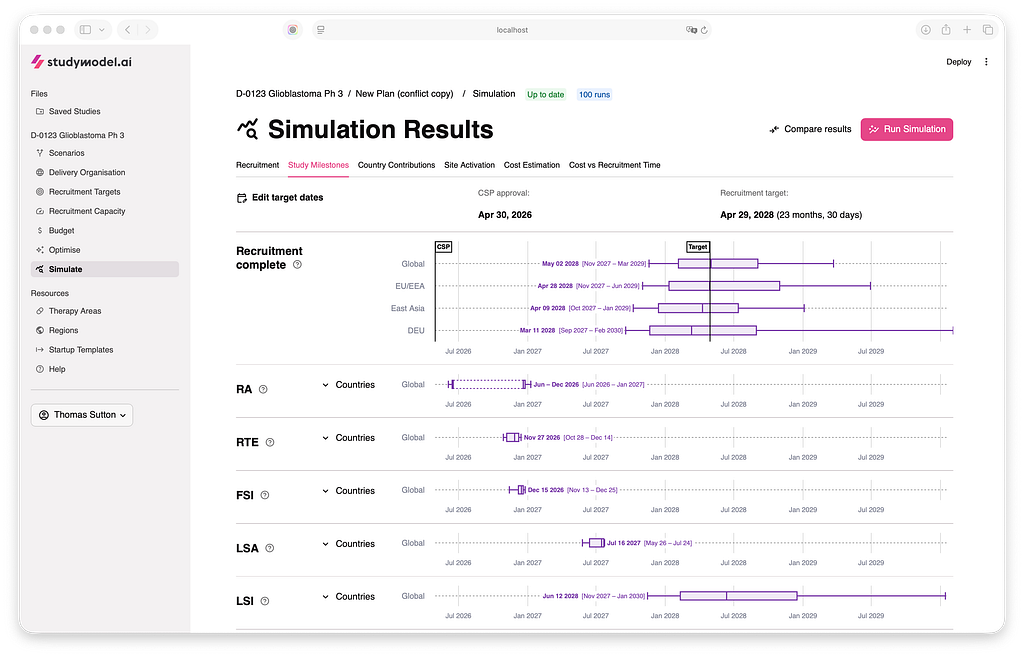
Let the data draw the page for you
Rather than designing a page that you “fill” with content, create building blocks from the data and assemble them according to its logical structure. This is not word-play — it’s really a Copernican shift – the data is the interface.
Strip back the chrome
Let the actions that you can perform live in/on the data representation as much as possible. This is similar to Edward Tufte’s “data-ink maximisation principle” but expanded to include application scaffolding as well as data display. Ideally, if there is no data, the page is (almost) completely empty, which leads to the next suggestion…
Design the empty state
Why is it empty? Is it a starting state (e.g. the blank page of a design tool), an error mode, a transitional state, or a desired outcome (e.g. an empty list of issues/errors). Should the page/component even exist if it’s empty, or should that emptiness be caught upstream? If it should exist, what can you meaningfully tell/show the user to make sense of the absence?

Work with real(istic) data
Never draw detailed static pictures of dynamic data representations — thats just a huge waste of time and energy, the design will be naive and you’ll create busywork for developers trying to reproduce your picture in code. Prototype it (or even better — build it directly in the product code-base). Do it yourself, or side by side with a design engineer. Have a few different datasets always on hand that you can use to view the interface in multiple states. Prepare for enduser reviews by building and testing datasets that are tailored to the user profile — often this will highlight weak points in the design that you can address before user testing.
Pre-populate intelligently
You can infer a lot about the user from their data and history. Use it to save them time by pre-populating with most likely values (while letting them override, of course). This is one of the most overlooked opportunities for reducing friction, because it requires you to really understand the data landscape…but if you made it this far, you probably do!

Bridge mental models and data models
This is the core of your job and you will not get it right first time — you have to give yourself time to let it emerge. The user has a mental model based on their domain and their job to be done. The system has a data model and a logical structure. You can influence both models and it’s important they aren’t in direct contradiction — but they will never be identical and that’s ok. You need a way of structuring and communicating information between user and system that is a lingua franca between these different models. And like any lingua franca, it will be a living, evolving compromise.
Words matter
Figure out what to call things, and do it consistently. Sometimes you’ll be able to use the users’ own domain language (great!) and sometimes you’ll have to provide them with a new word for a system concept (tread carefully, cognitive burden alert!). Don’t be afraid to use tooltips and call-outs to provide long-form explanations of what things are or how they work. And hopefully this goes without saying in 2026…no dummy text, ever!

Simple and explicit navigation
“Where am I” is a multilayered question in a data-intensive application. Its never as simple as “what page am I on?”. For users navigating a multidimensional data landscape, it includes things like “what data am I looking at?”, “what is its recency and provenance?”, “how is it filtered/sliced?”, “what stage am I in a process?”, “what version/scenario is this?”, “what has changed”, etc. Use tried and true patterns — your goal is not delight and surprise — it is transparency, predictability, and control.

As you absorb these principles and develop a more data-aware approach to design, you’ll find that what you see when you look at the interface changes.
- from a “form” to an expression of intent or need
- from a “graph” or a “table” to the meaning of the data they show
- from visual hierarchy to conceptual hierarchy
- from interacting with the application, to interacting with the data it contains
And yes, you will still have forms, and graphs and tables, and visual hierarchy, and an application — they haven’t suddenly vanished — but now you see them as you want your user to, in a flow state, focussed on their real-world task and objective. And the things that stand out to you will no longer just be those that are ugly, or off-brand, or visually awkward — but rather those that break that flow state, create confusion or disorientation, and erode user trust. And that, hopefully, will make you a better designer.
Resources
- I found the datacamp developer and data scientist tracks tremendously helpful at the beginning of my solo builder journey.
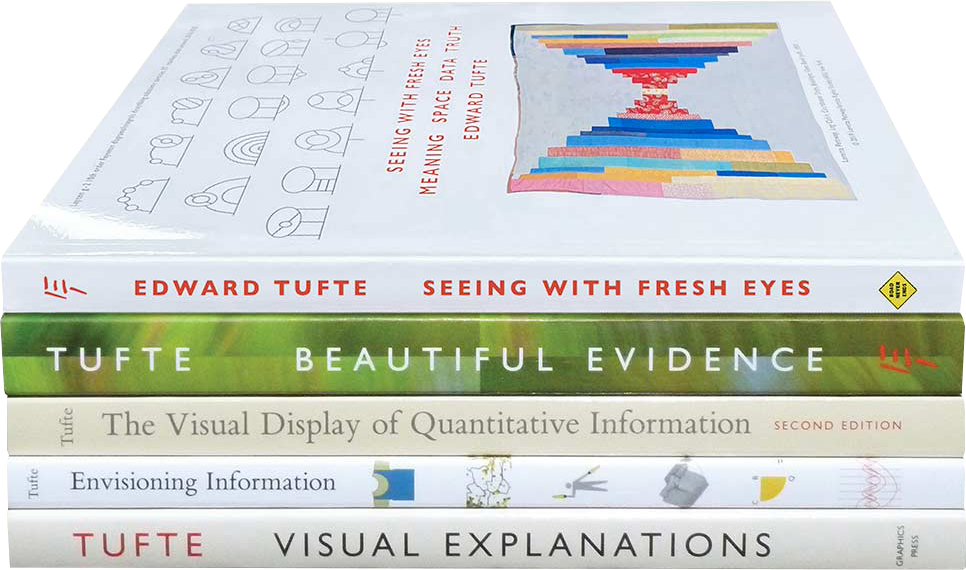
- Amongst Tufte’s books, the most valuable for me remains his first, The Visual Display of Quantitative Information.
- I first learned about designing with words through Content Design by Sarah Winters and Rachel Edwards.
- I knew I crossed the point of no return when Design Patterns started making sense to me. Refactoring Guru is a great companion resource with example patterns in different programming languages.
- NN/G are an evergreen source of grounded knowledge about designing complex software.
- For agentic/LLM-based interactions, LukeW has been sharing some great early frameworks.
Designing data-intensive applications — advice for interaction designers was originally published in UX Collective on Medium, where people are continuing the conversation by highlighting and responding to this story.