Why data tables are an accessibility blind-spot (and how WCAG helps)
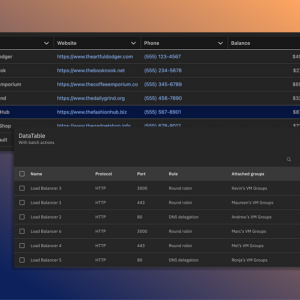
Data tables are used in many different products and contexts. They are used in dashboards, product comparisons, or even internal finance reports. They help users make decisions, spot data patterns, and take action where needed.
But when it comes to accessibility, data tables are often skipped. They’re assumed to be handled by default HTML or put off until the development stage.
Visually, the tables look easy to read with clear columns and rows, as well as distinct headers. But for many users (like those using screen readers or keyboard navigation), these tables can become confusing or even unusable.

Just to be clear; WCAG doesn’t prohibit data tables, it just requires that the table’s information, relationships, and functionality are available to all users. Not only that, you don’t need complex solutions to have both data tables and WCAG-compliant designs.
Let’s break down why data tables are frequently overlooked, what WCAG requires of them, and how designers and product teams can create accessible data tables.
Why are tables an accessibility blind-spot?
To be fair, data tables sit in an awkward spot between design and development. They feel too technical to be a pure design problem, but also feel too visual to be treated as just code. As a result, accessibility issues slip through the cracks.
But what specific issues come from neither design or dev taking full ownership of tables?
Tables lack semantic structure
Visually, most tables appear easy to scan with aligned column headers and distinguished rows. But when this same structure isn’t communicated properly in the code, assistive technologies lose the context that sighted users get visually.
Without proper header associations, a screen reader (like Voiceover or NVDA) may announce a value without indicating which column or row it belongs to.
For instance, let’s say there is a data table depicting the concerts you attended last year. A sighted user can easily understand when and where each concert was, but a screen reader announces “12 February” without the associated concert it corresponds to.

<table>
  <tr>
    <th>Date</th>
    <th>Event</th>
    <th>Venue</th>
  </tr>
  <tr>
    <td>12 February</td>
    <td>Waltz with Strauss</td>
    <td>Main Hall</td>
  </tr>
  […]
</table>
Design Systems with information gaps
Many Design Systems include a table component, but sometimes they don’t clarify how the component should be used in the wild. The guidance leaves open questions about accessibility, like:
- When should a table be used instead of a list?
- How should sorting behave?
- What happens when data is empty, truncated, or loading?
Without explicit standards, tables used by different teams behave differently, and accessibility becomes inconsistent.
Added interactions without accessibility
Modern tables are typically dynamic with sortable columns, selectable rows, and inline actions. But these interaction patterns are layered on top of the table without clear guidance on keyboard behavior, focus order, or screen reader announcements.
When accessibility is addressed late in development, teams might add impromptu ARIA attributes instead of designing inclusively from the start. This results in a table that “functions,” but feels unpredictable or exhausting to navigate with only a keyboard.

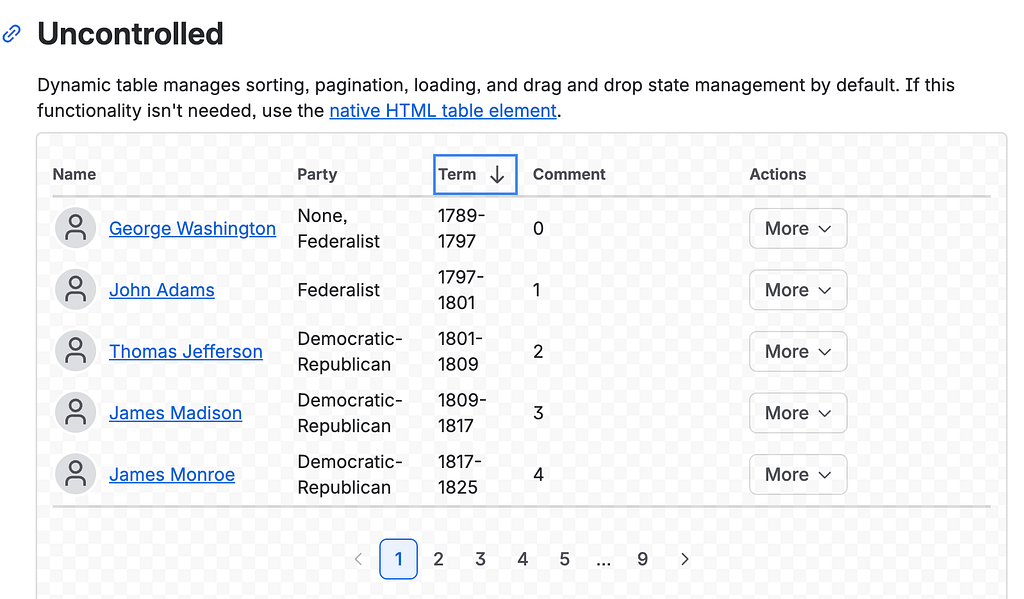
Anatomy of an accessible data table
Overall structure
- Rows and columns reflect the data’s relationships (not just visual alignment)
- Headers clearly describe the content they correspond to
- Reading order matches how the data is meant to be understood
Data relationships
- Individual values connect to both their column and their row headers (even in multi-dimensional tables)
- Context is communicated through programmatic associations (not only by visual means like spacing or alignment)
- Users navigate cell by cell and understand the data as a whole
Predictable navigation
- Filters, column headers, and actions have clear labels
- Keyboard focus is always visible on the data table
- Focus (tab) order aligns with the visual and logical layout of the table

Proper interactions
- Interactive tables have clear affordances, accessible labels, and visible states
- Users know when a column is sortable and which direction it’s sorted in
- Users know what happens when they activate a control with a keyboard or mouse
Note: This anatomy allows assistive technologies to answer basic questions like: What column am I in? What does this value represent? Without it, users are forced to guess.
WCAG criteria that matter most for data tables
WCAG doesn’t treat data tables as a special case. There’s no guideline that says “make tables accessible.” Instead, WCAG is more concerned with whether users can perceive relationships, operate functionality, and understand content within the table.
WCAG provides a framework, but it’s up to designers and teams to meet the expectations.
SC 1.3.1 Info and Relationships (Level A)
This criteria asks that all users can understand how headers relate to data cells, regardless of how the table looks visually. When header relationships are missing, assistive technologies can’t provide meaningful context.
Example techniques to pass:
- Use table markup to present tabular information (Technique H51)
- Use caption elements to associate the data table’s title or heading with the table (Technique H39)
- Use the scope attribute to associate header cells with cells in data tables (Technique H63)
- Use id and headers attributes to associate cells with header cells in data tables (Technique H43)
https://medium.com/media/338e43f81349ebc2a12841deaf0dd258/href
SC 2.1.1 Keyboard (Level A)
Any interaction included in a table must be operable using only a keyboard. This includes not only navigating the table itself, but also using features like filtering, pagination, and row-level actions.
Example techniques to pass:
- Ensure keyboard control for all functionality (Technique G202)
- Provide keyboard-triggered event handlers (Technique G90)
SC 2.4.3 Focus Order (Level A)
Users navigating with a keyboard need to know where they are at all times. WCAG requires visible focus indicators and clear communication of state changes.
Example techniques to pass:
- Place the interactive elements in an order that follows sequences and relationships within the content (Technique G59)
- Make the DOM order match the visual order (Technique C27)
SC 2.4.6 Headings and Labels (Level AA)
WCAG requires that controls and content have clear, descriptive labels. In data tables, this applies to the table’s title, column headers, and its interactive controls.
Example techniques to pass:
- Provide descriptive headings (Technique G130)
- Provide descriptive labels (Technique G131)
https://medium.com/media/64748825f9b314ce382b355646219ca9/href
SC 4.1.2 Name, Role, Value (Level A)
WCAG requires that content work reliably with assistive technologies now and in the future. For data tables, this means relying on semantic structure and predictable behavior rather than visually driven solutions.
Example techniques to pass:
- Use aria-label to provide an accessible name where a visible label cannot be used (Technique ARIA14)
- Use aria-labelledby to provide a name for user interface controls (Technique ARIA16)
What designers should do before dev touches code
Accessible data tables start with design decisions. Designers are responsible for preventing accessibility issues long before a developer ever starts coding. This includes defining design decisions like table structure, interactions, and data complexity.
Use real structure, not just layout
Before thinking about visual styling, designers should answer the following:
- What are the rows?
- What are the columns?
- What relationships matter most?
If these answers aren’t obvious in the design, they won’t be obvious to assistive technologies. You need clear column headers, meaningful row labels, and consistent data structure.
Have intentional interactions
Not every table needs sorting, filtering, or inline actions. Each interaction adds cognitive load and accessibility complexity. When interactions are necessary, designers should define:
- Which columns are sortable
- What happens when sorting is applied
- How users move between table content and controls
- If actions apply to a row, a cell, or the entire table
Design for keyboard users
Using a keyboard is a primary input method for many users. Designers need to ensure that tables can be navigated in a logical, predictable order by asking:
- Can every interactive element be reached without a mouse/ trackpad?
- Does keyboard focus move in a way that matches the table’s structure?
- Are hover-only actions also doable via keyboard?
Consider various screen sizes
Designers need to explicitly define how table structure and relationships are preserved across breakpoints. As the screen size shrinks, it’s simple to collapse and hide content, but designers should document:
- How labels remain associated with their values
- How users can navigate between the data
- How accessible interactions are maintained

Document table expectations in Design Systems
Data tables scale and remain consistent when they’re a shared standard. Documenting how tables behave is just as important as documenting how they look.
Helpful documentation includes:
- When to use a table (and when to other components like a list)
- Required semantics with structure, headers, and labels
- Keyboard and interaction behavior (like focus and pagination)
- Interaction states and edge cases (like empty, loading, or error states)
- Any known accessibility considerations or constraints
Data tables are treated as containers for information, but they’re some of the most complex elements users interact with. Without incorporating accessibility into tables, users lose context, navigation becomes frustrating, and critical data becomes hard to understand.
Complying with WCAG criteria helps all users no matter their ability. Accessible tables are easier to scan, more predictable to navigate, and clearly communicate meaning. They benefit screen reader users, keyboard users, and anyone working with dense data. When tables are designed with the same care as any other interface, accessibility follows naturally.
Data tables need to be accessible, too was originally published in UX Collective on Medium, where people are continuing the conversation by highlighting and responding to this story.